Clio Andris
Georgia Tech
Building Effective Regions for COVID-19 Policy Administration (Or: How Our States Got Their Shapes)
This work is conducted with Caglar Koylu (University of Iowa) and Mason A. Porter (UCLA).
Forward
We do many things at the state level in the United States: We elect senators and governors, pay taxes, pay in-state college tuition at state-defined rates, get married, get driver’s licenses, and follow state speed limits. But it’s not always best to do everything at the state level. Perhaps COVID-19 policies should not always be implemented at the state level.
The COVID-19 pandemic created and exacerbated political fissures within states. For instance, in Georgia in the spring of 2020, Savannah mayor Van Johnson unsuccessfully tried to impose a mask-wearing mandate to keep Savannah’s visitors and residents safe. Atlanta mayor Keisha Lance Bottoms also tried to invoke a mask-wearing mandate in Atlanta, Georgia; and Georgia Governor Kemp sued the city for overreach. Meanwhile, Southwestern Georgia was suffering devastating rates of COVID-19 deaths following a super-spreader funeral that became a nationwide lesson. Local government asked Kemp for intra-state regional groups that could produce their own responses to the virus. But they had no luck with that request.
Geographic theory tells us that in a networked society, states—as units that do not always follow human behavior—may not be the proper unit of analysis for the administration of policies to mitigate infectious diseases. States are heterogeneous in terms of population density, locations of vulnerable populations, numbers of at-risk institutions such as nursing homes, and mobility behaviors. State boundaries are rigid; they are often crossed for commutes, especially when metropolitan areas straddle multiple states. States are also not sufficiently granular for emergency messaging; the National Weather Service issues warnings and watches for storms, hurricanes, tornados, and even wind advisories at the county level. When it comes to health, logistical improvements in zones and regions can save lives: In one forward-thinking example, state zones were scrapped for more ‘sensible’ organ-donation zones.
COVID-19 response and policy coordination should be applied to regions of well-connected counties. Because movement and social-network ties correlate with the spread of COVID-19, we try to define these regions by leveraging natural human networks of commuters, daily trips, domestic migrants, and social networks. Although the concept of bottom-up regions from human behavior is not new—classic studies in regional science have delineated cultural regions and functional regions for decades—we use a larger suite of data sets and newer network modularity methods to create regions.
What We Did
We detected regions using input data of migrants from the U.S. Census American Community Survey, commuters from the U.S. Census LODES-LEHD data set, GPS traces from Safegraph, Twitter co-mentions, and social regions from Facebook. All data is at the U.S. county level for the 48 contiguous U.S. states. The networks are undirected and include self-edges. After testing various modularization (i.e., community-detection) algorithms through R’s igraph package, we used the Louvain clustering method to partition the networks.
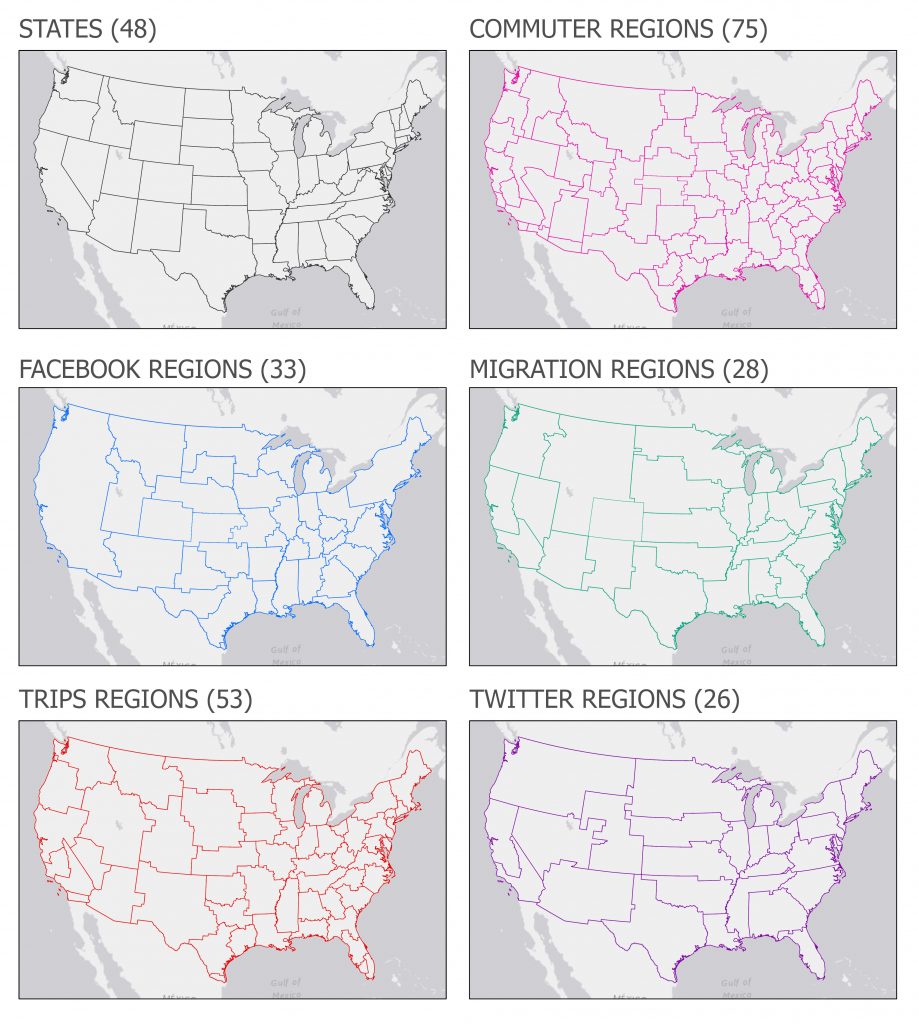
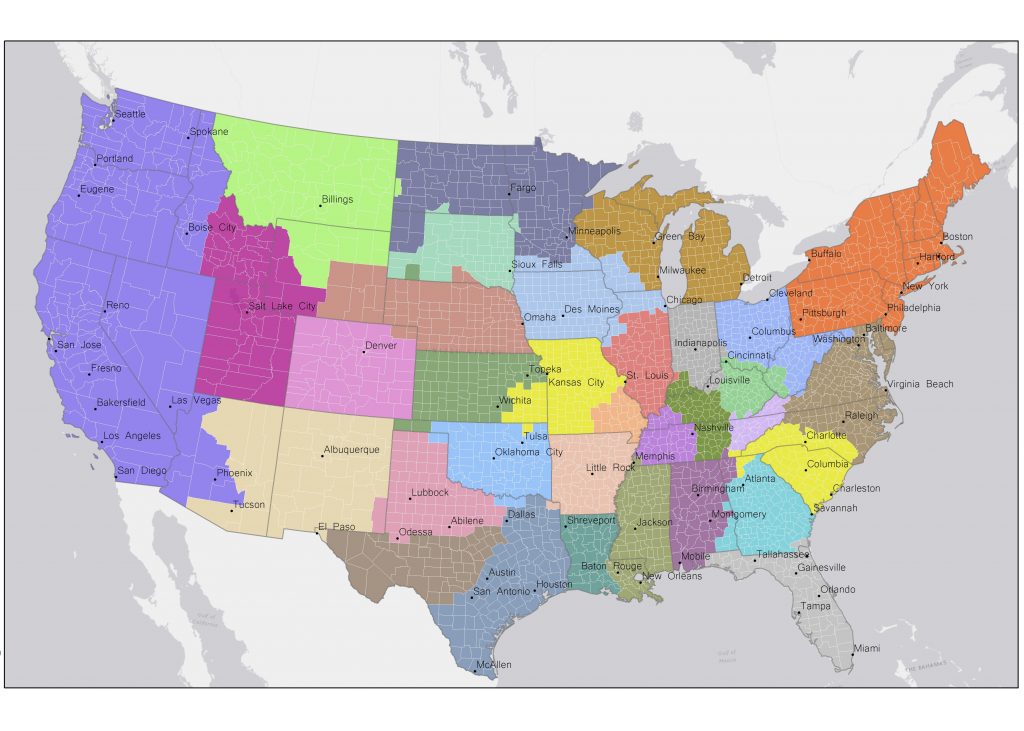
Figure: Resulting regions from the community-detection algorithm for five different input networks (and states). We show the numbers of regions in parentheses. These regions are our ‘independent’ variables; they have different numbers of regions and often follow state boundaries.
Our ‘dependent’ variables are COVID-19 cases, case rates (specifically, cases per 1,000 people), and case-rate differences from the New York Times COVID-19 Data. We calculate these variables for pairs of adjacent counties. There are a total of 8150 such pairs. We calculate each case count by computing the sum of the cases in two adjacent counties. We calculate each case rate by computing the sum of the cases divided by the sum of the populations in two adjacent counties. Each case difference is the absolute value of the difference between the combined case rates of the two counties in a pair. We want cases (C), case rates (CR), and case differences (CD) to be larger, larger and smaller, respectively, within these newly devised regions than they are between these regions because this would suggest that these regional boundaries are preventing spillovers of COVID-19 infections. We used median values and an ANOVA test to determine whether these rates are different across and between regions. Because we had five sets of regions and a set of states, we have six different cases. We also use three temporal ‘waves’, in accordance with peaks and troughs of cases, that coincided with the school year.
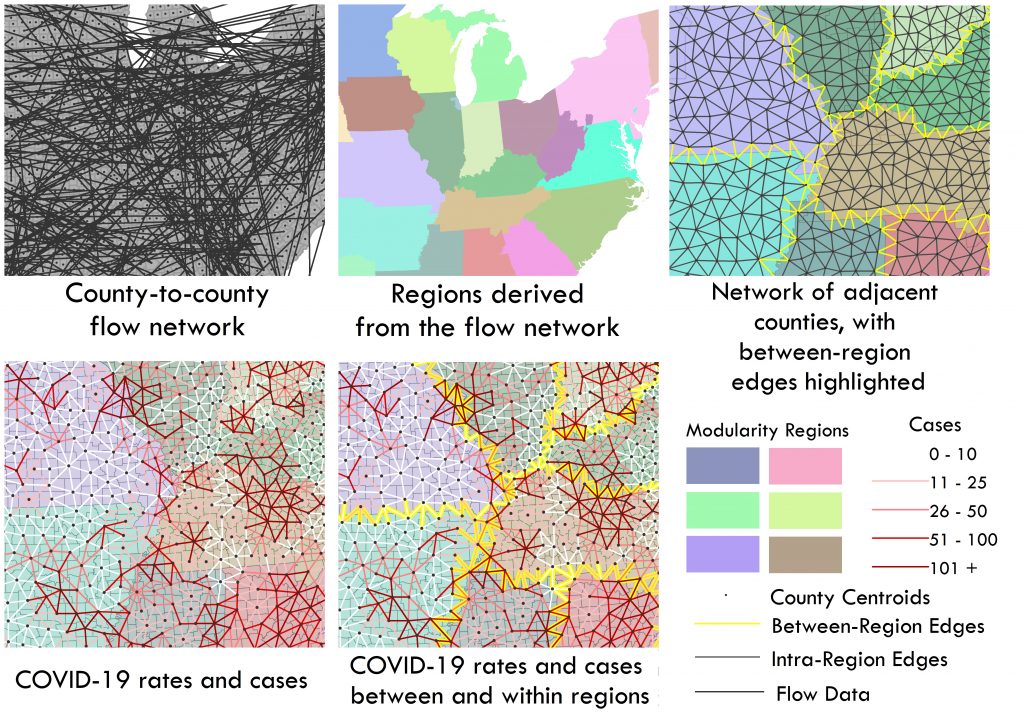
Figure: This figure walks through the steps of our analysis to create regions from network data and to determine whether these regions’ boundaries serve as natural boundaries for COVID-19 cases.
Results
We evaluated whether the COVID-19 cases (C), case rates (CR), and case-rate differences (CD) are different for pairs of adjacent counties that lie within regions (w) and between (b) regions. The regions that we construct from mobility networks (in our case, GPS traces and commuters) tend to result in well-connected regions with natural divisions between regions. Facebook boundaries perform the worst in this regard, followed by Twitter boundaries and state boundaries. The regions that we constructed using migration data gave mixed results.
Table: Median values of cases (C), case rates (CR), and case-rate differences (CD) for pairs of adjacent counties both within regions (w) and between regions (b). We show this data for our “third wave” (Aug 31 2020—Jul 1 2021).
But are these differences significant? An ANOVA test shows that there are significant differences across regions for case rates between regions—indicating that some borders (specifically, the commutes and the trips, followed by state boundaries) statistically perform better than others. There is little evidence for variation in regions for cases, and there is no difference for case-rate differences. We also calculated a quantity that normalizes cases by the potential for case crossings. This is the ratio of cases between and within regions (Cb/Cw) divided by the potential for a set of adjacent counties between or within regions (Eb/Ew). This quantity ((Cb/Cw)/(Eb/Ew)) reflects the effectiveness of each region at “containing” cases and is smallest (and hence best) for commutes and trips.
Takeaway Message
We used network-partitioning methods to build regions from the “bottom up” and found that those that we constructed from movement data can be used to delineate COVID-19 core regions more effectively than states. These resulting smart regions are tailor-made to reflect the behaviors that transmit disease. We hope these findings can help policy-makers develop county-level pacts (i.e. regions), and apply homogenous policies to these regions.
A note on replicability
For the input networks, the migration and commuter data sets are public information from the U.S. Census. The Facebook regions, Twitter data, and Safegraph traces must be acquired by contacting the owners. However, all R and python code is open source and will be made available for use upon publication of the manuscript that is associated with this project. We have also created an online tool to allow users to create their own regions by weighting input network data.

Cheryl Coleman commented on December 19, 2021 at 6:14 am
The article mentions an online tool for creating regions using input network data. Where can I find this tool? Thank you.
Clio Andris commented on January 3, 2022 at 2:15 pm
It is available here: https://www.geo-social.com/consensus_regions/index.html thanks to Caglar Koylu for creating this tool.