5 notebook results
Rapidly Measuring Spatial Accessibility of COVID-19 Healthcare Resources: A Case Study of Illinois, USA.
Posted by Admin CyberGISX on Wednesday May 27, 2020
This aims to measure spatial access for people to hospitals in Illinois The spatial accessibility is measured by the use of an enhanced two-step floating catchment area (E2FCA) method, which is an ...
Data Location:
- Illinois
Spatial Correlation Analytics Between Population and COVID-19 Confirmed Cases in New York State
Posted by Admin CyberGISX on Tuesday March 31, 2020
This jupyter notebook demonstrates spatial correlation analytics between population and CVOID-19 Confirmed cases in New York State We are using New York State, the US as our study area And this ...
Data Location:
- New York
COVID-19 Choropleth Maps
Posted by Admin CyberGISX on Tuesday March 31, 2020
In this notebook, we are doing a simple visualization creating Choropleth Maps at the county level For this example, we are using data released by Johns Hopkins University ...
Data Location:
- United States
A Reproducible and Replicable Spatially Explicit Agent-Based Model Using CyberGIS-Jupyter: A Case Study in Queen ...
Posted by Admin CyberGISX on Tuesday March 31, 2020
This notebook walks through how to acquire the necessary geospatial, health, and sociological data required to create a spatially-explicit agent-based model of influenza spread Using the Queen-Anne ...
Data Location:
- Seattle
The Context Makes the Difference: Reproducibility and Replicability in Measures of Spatial Accessibility
Posted by Admin CyberGISX on Friday December 20, 2019
This notebook demonstrates a study on food accessibility addressing two research questions: 1) what is the service area of particular grocery stores and 2) what impact do individual user preferences ...
Data Location:
- Illinois
Filter by Keyword
- Bivariate analysis 1
- Community 1
- Community Detection 1
- COVID-19 9
- Credibility 1
- Cybergis 1
- Disability 1
- Human Mobility 2
- Incidence 1
- Johns Hopkins 1
- Migration 1
- Mobility 1
- Modularity 1
- Mortality 2
- Networks 1
- Policy 1
- Regional Science 1
- Regions 1
- Replicability 1
- Replication 1
- Reproducibility 1
- Reproduction 1
- SafeGraph 1
- Social Distancing 1
- Social Media 1
- Spatial Accessibility 1
- Spatial Cluster 1
- Spatial Pattern 2
9 blog results
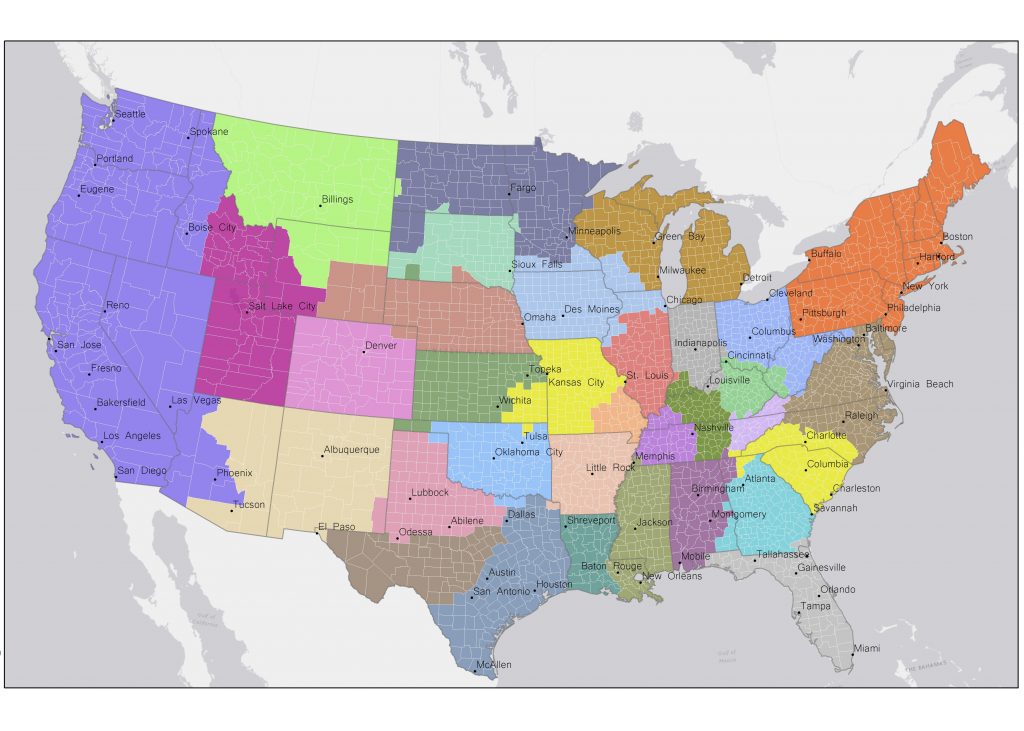
Building Effective Regions for COVID-19 Policy Administration (Or: How Our ...
This work is conducted with Caglar Koylu (University of Iowa) and Mason A Porter ...
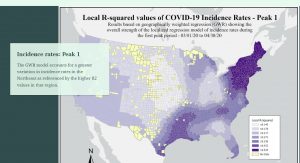
Story Map on COVID-19 Research
I have designed a story map summarizing the key findings of my GSF project that is concerned with ...
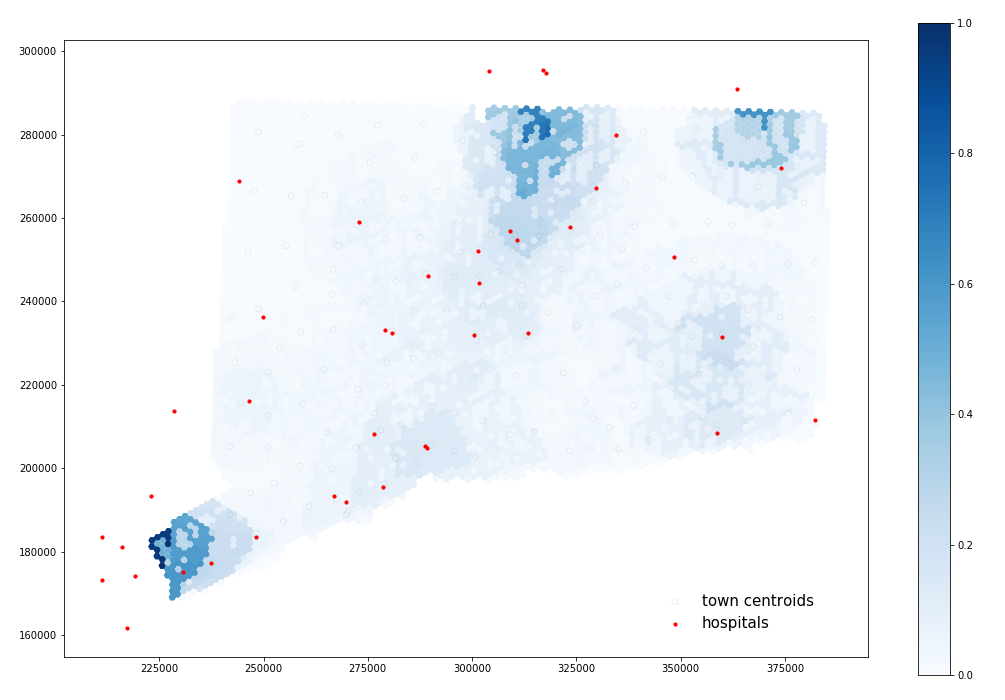
Middlebury College Students Reproduce and Replicate COVID-19 Health Care Resource ...
The Geospatial Software Institute Fellows for Advancing COVID-19 Research & Education program ...
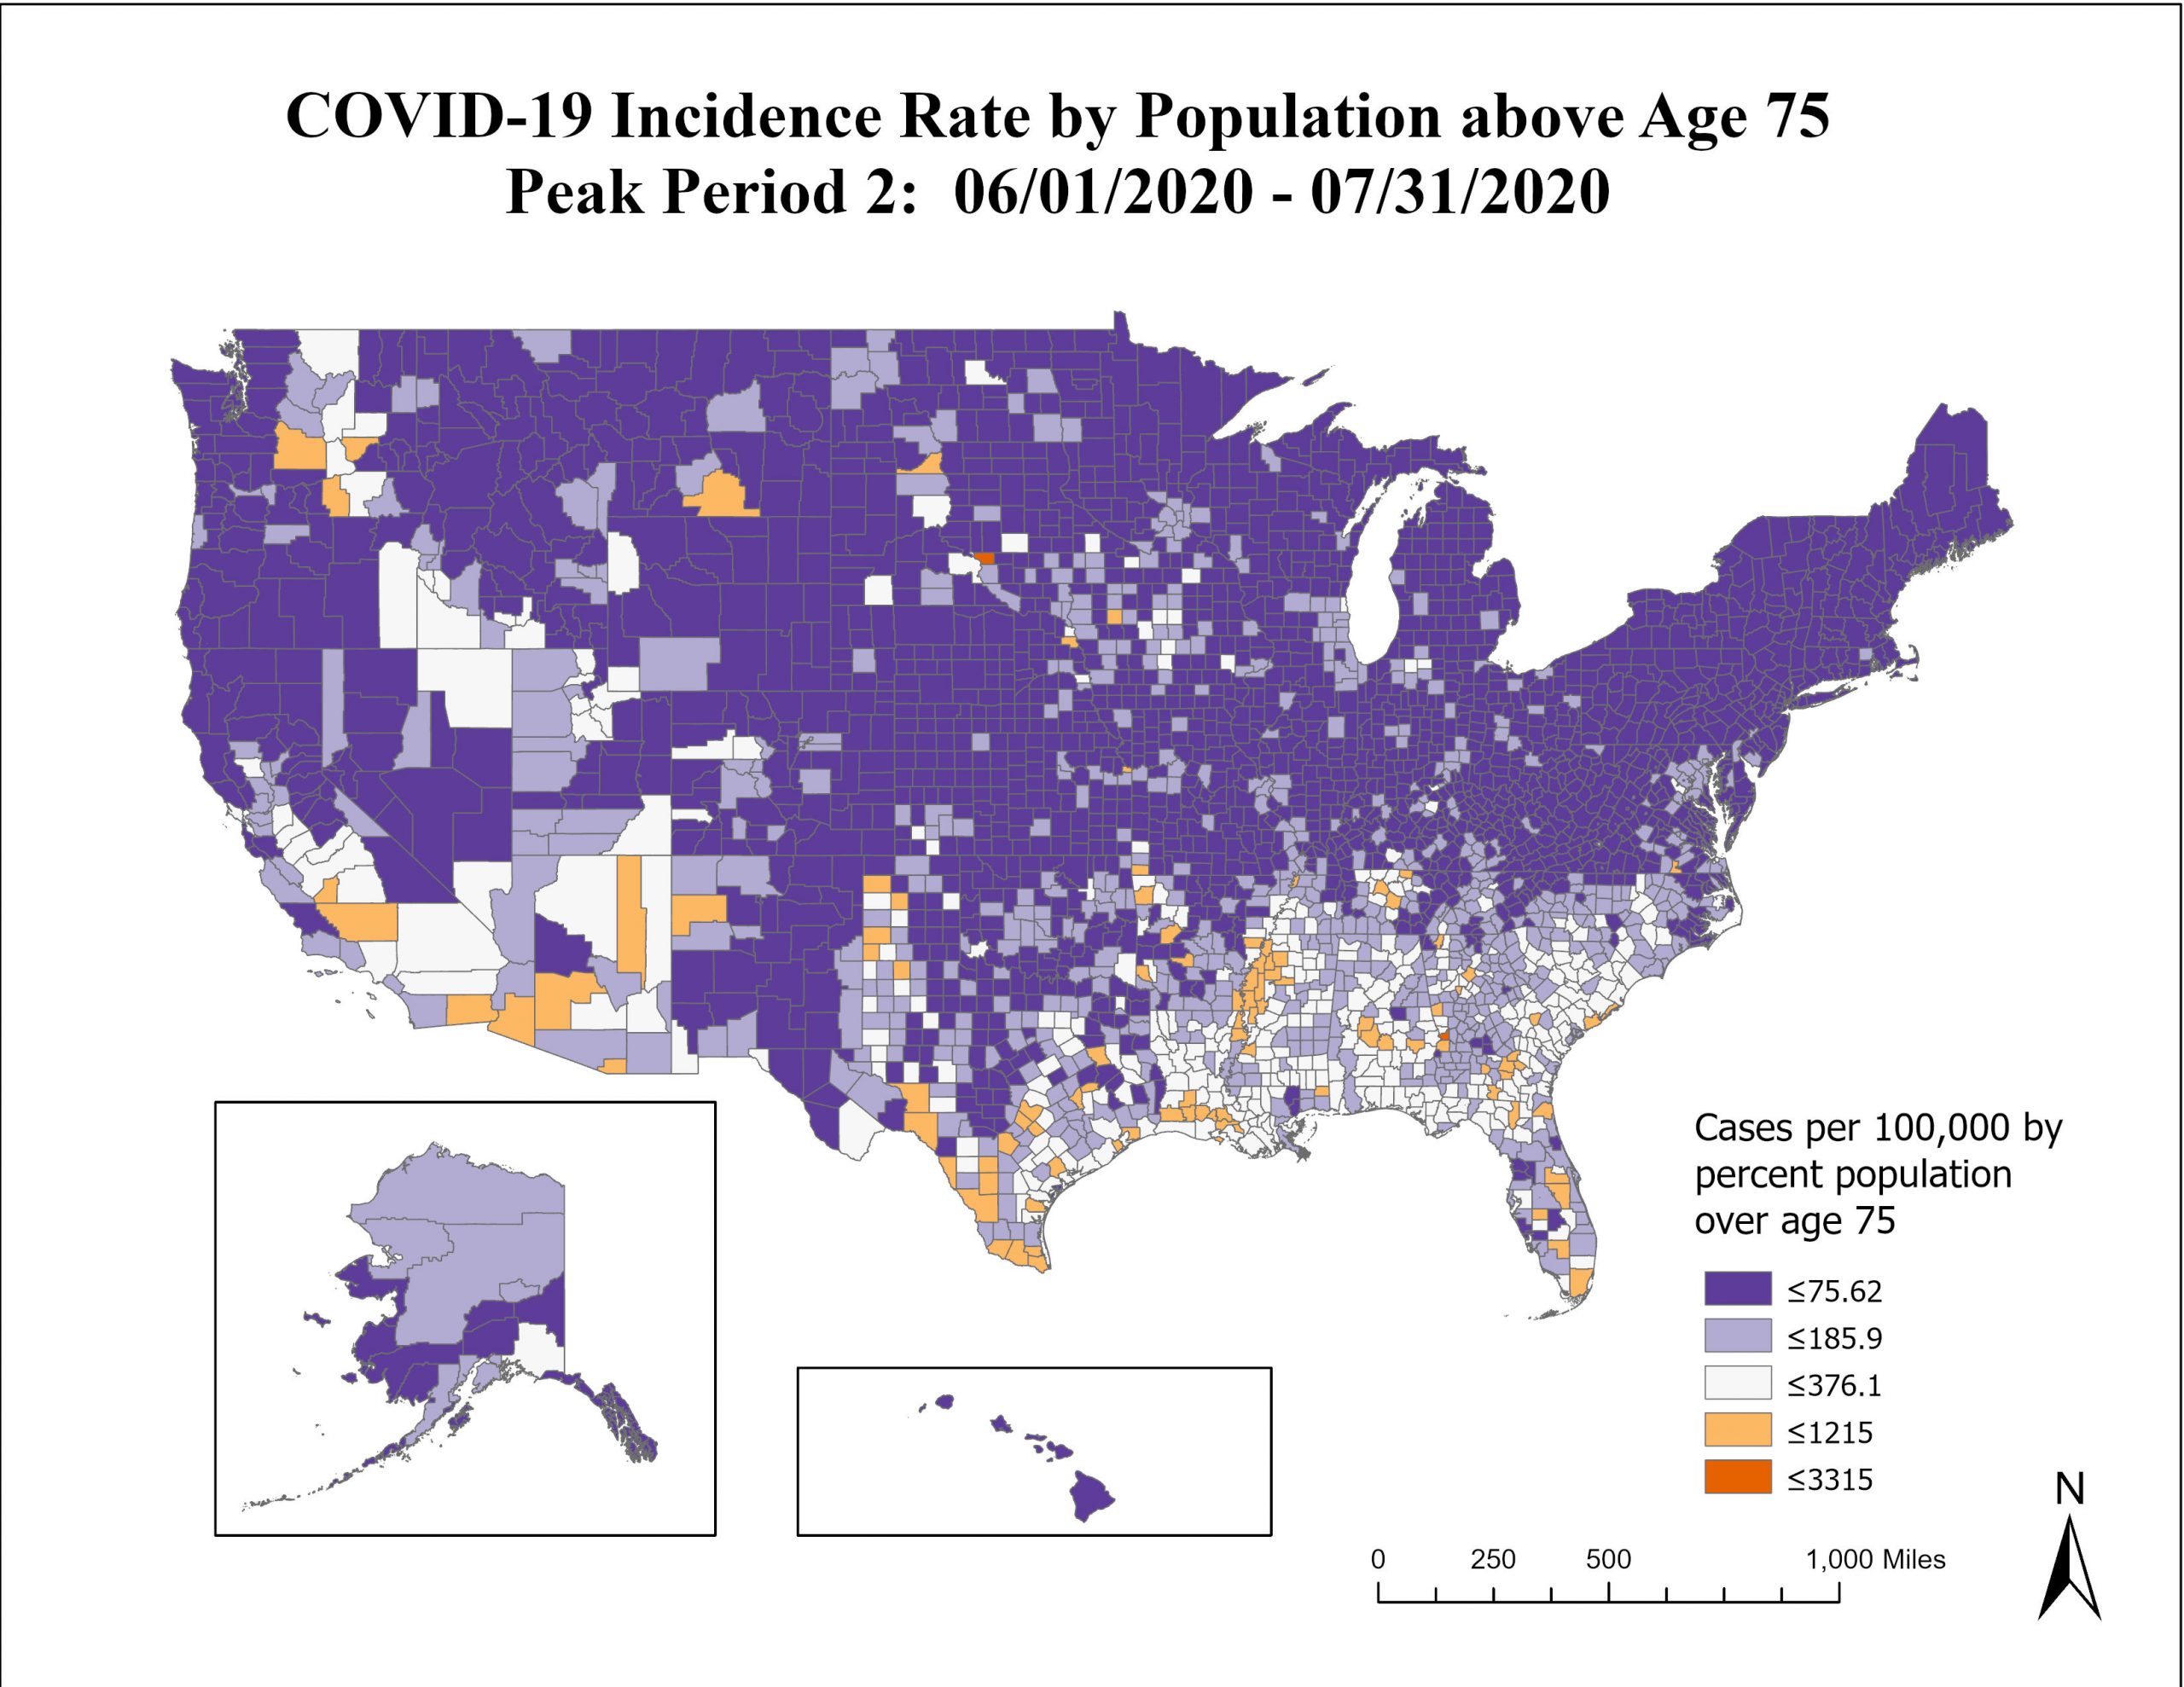
Age and Morbidity Trends related to COVID-19
I am conducting a county-level assessment of COVID-19 in relation to age demographics and ...
Presentation: Working with Students to Reproduce COVID-19 Research to Establish ...
On October 19, 2020, Peter Kedron and Joseph Holler co-presented a workshop on reproducibility and ...
How would social distancing change the COVID-19 curve of community ...
The rapid development of the coronavirus (COVID-19) has prompted unprecedented global health ...

COVID-19 and People with Disabilities
The first phase of my project focuses on the relationship between COVID-19 prevalence and people ...

Mapping Human Mobility OD Flow Changes in the US during ...
Understanding dynamic human mobility changes and spatial interaction patterns at different ...

COVID-19 Incidence and Mortality maps
For my GSF project, I will be conducting a county-level assessment of COVID-19 in relation to age ...