Joseph Holler
Middlebury College
Middlebury College Students Reproduce and Replicate COVID-19 Health Care Resource Accessibility Study
The Geospatial Software Institute Fellows for Advancing COVID-19 Research & Education program combined with the CyberGISX cyber-computing platform provides a unique opportunity to coordinate open geospatial research on COVID-19. Our team (Dr. Peter Kedron and Dr. Joseph Holler) is bringing together students and CyberGIS Fellows to perform test and improve the reproducibility of COVID-19 research.
In our first project, two senior undergraduate geography students at Middlebury College—Derrick Burt and Kufre Udoh—reproduced and replicated Kang et al’s 2020 paper on the spatial accessibility of COVID-19 healthcare resources in Illinois and published their work on GitHub.
- Derrick Burt, replicating the study in Connecticut: https://derrickburt.github.io/opengis/ctCovid/ctCovid.html
- Kufre Udoh, reproducing the study: https://kufreu.github.io/geog0700/geog0700.html
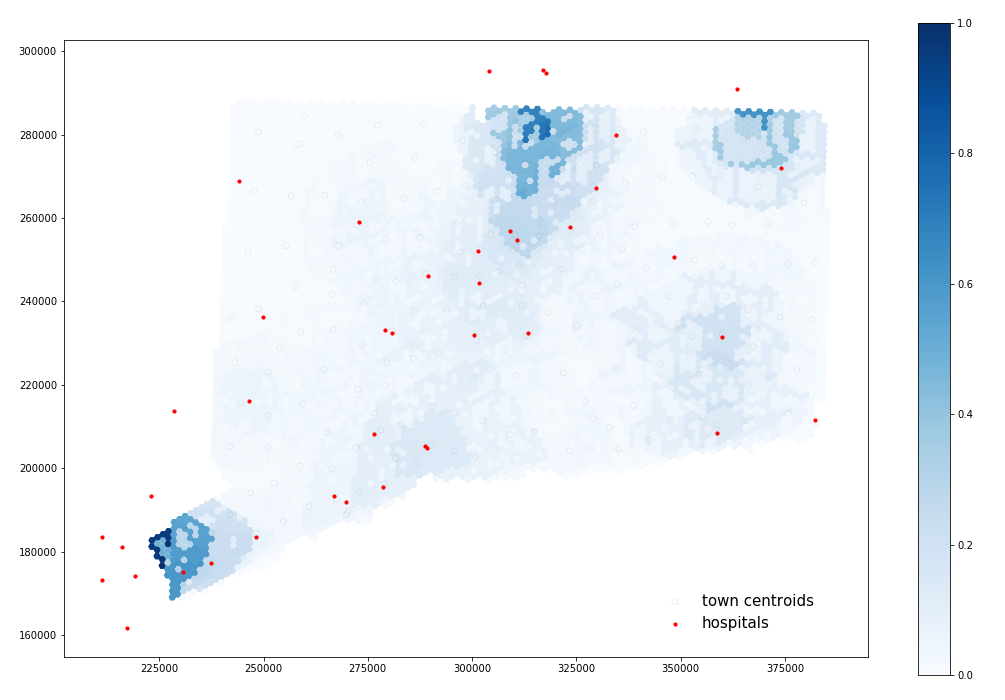
Spatial Accessibility of COVID-19 Health Care Resources in Connecticut. Red circles represent hospitals and the blue gradient represents accessibility, with dark blue being more accessible. Map created by Derrick Burt.
Key Findings from the Student Reproduction and Replication
Successes:
- With some very minor code modifications, the Jupyter notebook can reproduce the analysis of spatial accessibility of two populations (COVID-19 cases or people over the age of 50) and two health care resources (ICU beds or Ventilators) for the city of Chicago, Illinois!
- By searching for some additional data resources and making further minor modifications to the code, the Jupyter notebook can be used to replicate the analysis of spatial accessibility for another state, illustrated with Connecticut.
- The code available on the CyberGISX platform clarifies methodological decisions that were uncertain based upon the published paper alone. Specifically, techniques for road network simplification and for enhanced two-step floating catchment method (E2SFCA) contain more detailed information in the Jupyter notebook than in the publication.
- The data provided with the Jupyter notebook enabled the study to be reproduced, but some data-preprocessing described in the published paper occurred prior to the first lines of the notebook’s code. For instance, tabular COVID-19 data had been joined to zip code tabulation areas, American Community Survey data had been processed to calculate the total population over 50 years old, and hexagonal tessellations had been generated with an area attribute field, presumably using an algorithm like QGIS
Create Grid. Kufre developed an R-script to automate much of the data gathering and processing.
Limitations:
- The computing resources available on a typical desktop computer or CyberGISX virtual server are insufficient for calculating network-based accessibility for the entire state of Illinois. This is not surprising given that a main contribution of this research paper was a parallel processing strategy for the computationally expensive task of calculating E2SFCA accessibility. However, if independent researchers are interested in reproducing or replicating the analysis with regions requiring as much data as the state of Illinois, then they will need to develop or access cyber-infrastructure comparable to the authors’ system.
- Ideally, this type of accessibility analysis would include a buffer of data outside the region of interest (Illinois), including services, populations, and road networks. However, this is not possible for most regions in the United States because COVID-19 cases are not consistently reported at the sub-county level, as illustrated by this map created by Dr. Clio Andris and students. Therefore, some caution should be used interpreting results within 30 minutes’ drive from the Illinois border. Data on intensive care unit beds and ventilators in hospitals also vary by state and jurisdiction.
- The Python notebook is focused on reproducing the E2SFCA component of the research paper. It needs additional code to record processing times, analyze patterns of accessibility vis a vis the CDC Social Vulnerability Index, and create the histograms, scatter-plots, t-tests, and correlation analyses in the paper’s results.
Caution:
- The CyberGISX environment has installed version 0.11.4-py_1 of the OSMnx package for network analysis with OpenStreetMap, while the current version of the package is 1.0.1. The OSMnx package underwent a significant overhaul in the summer of 2020, as documented here and here, including changes to the functions for saving and loading graphs. One new feature of the library is an option to create a network based on OSM data at a particular date, which should aid in research reproductions using a data source undergoing daily revisions.
About Derrick and Kufre
Derrick Burt and Kufre Udoh are undergraduate geography students at Middlebury College. At the time of the reproduction and replication attempts, Both Derrick and Kufre had already completed their geography major requirements, including introductory courses GIS and an advanced course in Open Source GIScience in which we learned the QGIS graphic modeler, PostGIS spatial SQL, and some batch scripting and R. Both students had previously or concurrently studied introductory data science with R, and Kufre had studied introductory computer science with Python.
About the Original Study
Kang et al. (2020) applies an enhanced two-step floating catchment area (E2SFCA) method to calculating the spatial accessibility of health care services–ICU beds and ventilators–for treatment of severe COVID-19 cases, and geographic analysis of social vulnerability. The paper was published along with a public Jupyter Notebook and is the analytical basis for a Spatial Access web map application.
References
Boeing, G. 2017. OSMnx: New Methods for Acquiring, Constructing, Analyzing, and Visualizing Complex Street Networks. Computers, Environment and Urban Systems 65, 126-139. doi:10.1016/j.compenvurbsys.2017.05.004
Kang, J. Y., A. Michels, F. Lyu, Shaohua Wang, N. Agbodo, V. L. Freeman, and Shaowen Wang. 2020. Rapidly measuring spatial accessibility of COVID-19 healthcare resources: a case study of Illinois, USA. International Journal of Health Geographics 19 (1):1–17. https://doi.org/10.1186/s12942-020-00229-x.
